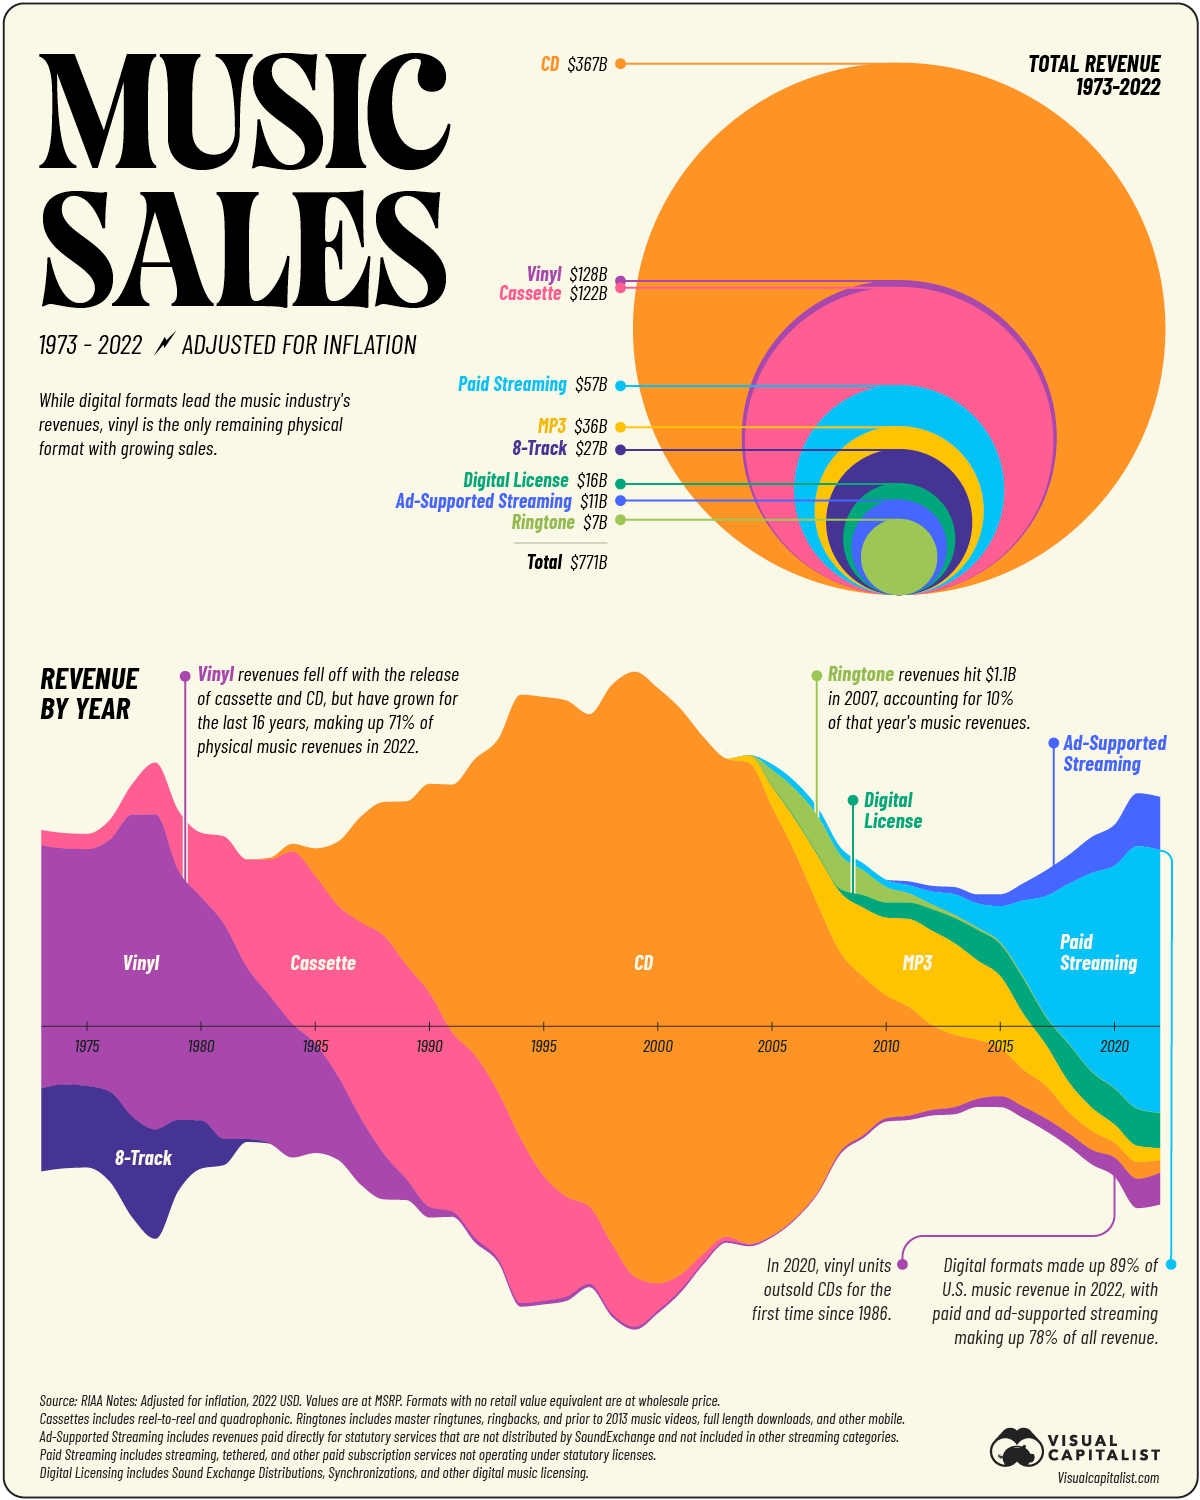
surface of the circle is directly proportional to the revenue, this presentation is much better to compare two values to each other (if you have problem comparing how much 367 is compared to 128 and need an image for that, that is). it would be harder in the pie chart.
if you want share of the total, the bottom graph is much better for that (and it adds layer of information that pie graph wouldn’t have).
While I agree that comparing them by eye is difficult compared to rectangles of equal width (i.e., a bar chart), it’s a bit of a stretch to say that it barely looks bigger. The radius to get double area is sqrt (2), or almost half as large again. The same ratio as used in standard A series paper. You wouldn’t say that the long side of paper “barely looks bigger” than the short side.

surface of the circle is directly proportional to the revenue, this presentation is much better to compare two values to each other (if you have problem comparing how much 367 is compared to 128 and need an image for that, that is). it would be harder in the pie chart.
if you want share of the total, the bottom graph is much better for that (and it adds layer of information that pie graph wouldn’t have).
i assume that is why.
Circle area’s are really hard to compare. A circle with double the area of another barely looks bigger.
While I agree that comparing them by eye is difficult compared to rectangles of equal width (i.e., a bar chart), it’s a bit of a stretch to say that it barely looks bigger. The radius to get double area is sqrt (2), or almost half as large again. The same ratio as used in standard A series paper. You wouldn’t say that the long side of paper “barely looks bigger” than the short side.
But circles are hard to compare directly. A square would be much better or even a bar chart.
This is trying to be flashy and it gets in the way of the information.