The article was interesting, but remarkably low on numbers - no distribution in percentages, no estimate in mass, no graphs. I’ll try to fill the gaps then.
Basically, there are various sources of methane on Earth:
agriculture (~217 Tg / year)
natural wetlands (~181 Tg / year)
industry (~111 Tg / year)
other natural sources (~37 Tg / year)
biomass and biofuel (~30 Tg / year)
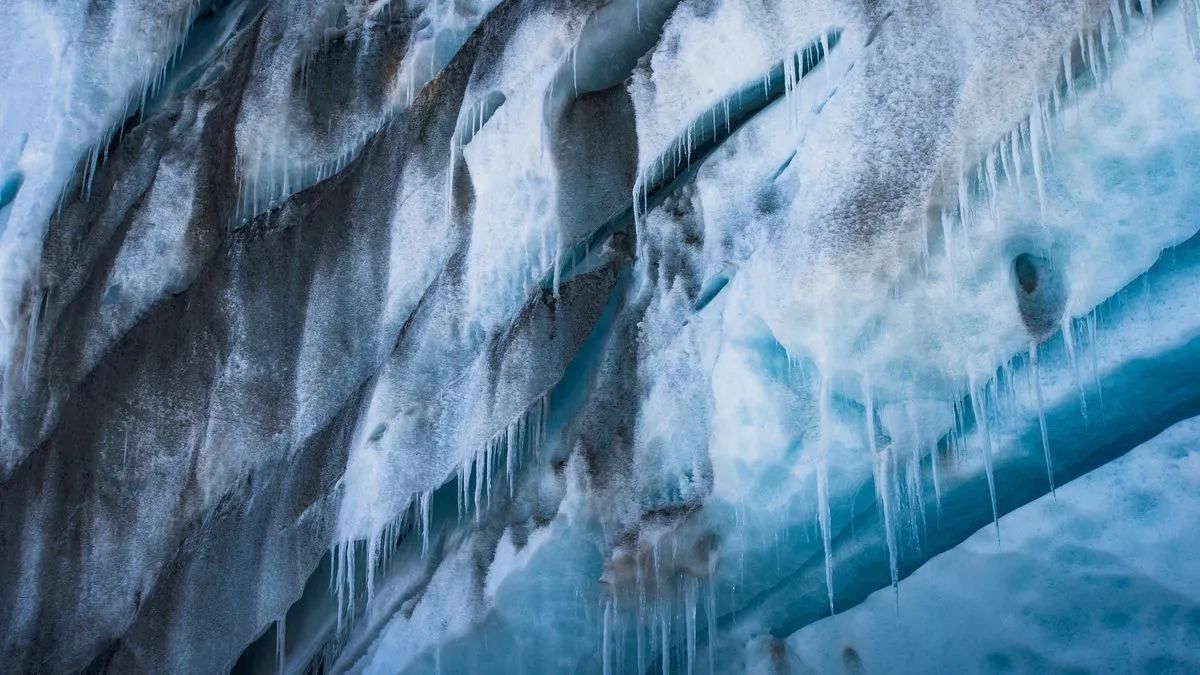
Arctic permafrost and oceanic hydrates (varies, estimated contribution 0.5 C warming during this century)
My overall conclusion: agriculture is the lowest-hanging fruit, its emissions are the biggest. However, industrial emissions may be easier to regulate since it’s more centralized.
The article was interesting, but remarkably low on numbers - no distribution in percentages, no estimate in mass, no graphs. I’ll try to fill the gaps then.
The article assiciated with the last map is here.
Basically, there are various sources of methane on Earth:
My overall conclusion: agriculture is the lowest-hanging fruit, its emissions are the biggest. However, industrial emissions may be easier to regulate since it’s more centralized.
Most industrial methane emissions are from losses of natural gas. It is pretty closely linked to getting off co2 that way.